Muto By Example
In this section, we will quickly describe how to start and get familiar with using Muto runtime by the way of examples.
Prerequisites
Starting a device with muto and F1Tenth simulator example
Edit your muto configuration
Open example.yaml under the src folder and edit to initialize the the host app with the LiveUI config:
  muto:
    stack_topic: /stack
    twin_topic: /twin
    type: simulator
-   twin_url: "http://localhost:8080"
+   twin_url: "http://ditto:ditto@sandbox.composiv.ai"
    commands:
        - name: ros/topic
          service: rostopic_list
          plugin: CommandPlugin
        - name: ros/topic/info
          service: rostopic_info
          plugin: CommandPlugin
        - name: ros/topic/echo
          service: rostopic_echo
          plugin: CommandPlugin
        - name: ros/node
          service: rosnode_list
          plugin: CommandPlugin
        - name: ros/node/info
          service: rosnode_info
          plugin: CommandPlugin
        - name: ros/param
          service: rosparam_list
          plugin: CommandPlugin
        - name: ros/param/get
          service: rosparam_get
          plugin: CommandPlugin
        - name: bcx/rc
          service: bcx_remotecontrol
          plugin: CommandPlugin
    pipelines:
        - name:  start
          pipeline:
            - sequence:
              - service: muto_compose
                plugin: ComposePlugin
              - service: muto_start_stack
                plugin: ComposePlugin
          compensation:
            - service: muto_kill_stack
              plugin: ComposePlugin
        - name:  kill
          pipeline:
            - sequence:
              - service: muto_compose
                plugin: ComposePlugin
              - service: muto_kill_stack
                plugin: ComposePlugin
          compensation:
            - service: muto_kill_stack
              plugin: ComposePlugin
        - name:  apply
          pipeline:
            - sequence:
              - service: muto_compose
                plugin: ComposePlugin
              - service: muto_apply_stack
                plugin: ComposePlugin
          compensation:
            - service: muto_kill_stack
              plugin: ComposePlugin
    mqtt:
-     host: localhost
+     host: sandbox.composiv.ai
      port: 1883
      keep_alive: 60
      user: none
      password: none
    thing:
      namespace: org.eclipse.muto.sandbox # subject to change
      definition: org.eclipse.muto:EdgeDevice:0.0.1
      attributes:
        brand: f1tenth.org
        model: f1tenthsimulation
      anonymous: False  # Use this for automatically generated id (uuid based)
      #   if anonymous is True or anynoymous param is missing, name/id will be auto generated
      # TODO: edit the name below
+     name: bcx-f1tenth-01
Launch a simulated muto device in a docker container
Muto has 3 main docker images.
- ROS image
This image is the typical standard ROS image + ROS Docker Image
Standalone Muto Image
This image contains the ROS Image + Muto Core , Muto Composer, Muto Messages and Muto Agent.
Demo Image
This image contains the Standalone Muto Image with the F1Tenth algorithms such as :
- Gap follower
- Wall follower
- Time Elastic Band
- Rosbridge
docker run --name muto-demo --rm -it \
   -v $(pwd)/example.yaml:/home/muto/launch/config/muto.yaml  \
   -p 7777:7777 -p 11311:11311  \
   composiv/muto-demo:noetic-ros-base-focal  \
   /bin/bash -c "source devel/setup.bash && roslaunch launch/demo.launch"
What happened ?
So, what happened ?
Muto agent, Muto Composer and Muto Core launched on the vehicle.
We subscribed to ditto and the rosbridge which provides the service through the websocket became online through the port that we defined. (7777 in this case)
Connected with result code Success
Subscribed to:  org.eclipse.muto.sandbox.f1tenth:docs-bcx-01/#
...
Why did these items launch ?
The corresponding items were insterted within the .launch file, hence we can see the items.
Now for the next step;
Simulation and Data Observation using Muto Dashboard and Foxglove
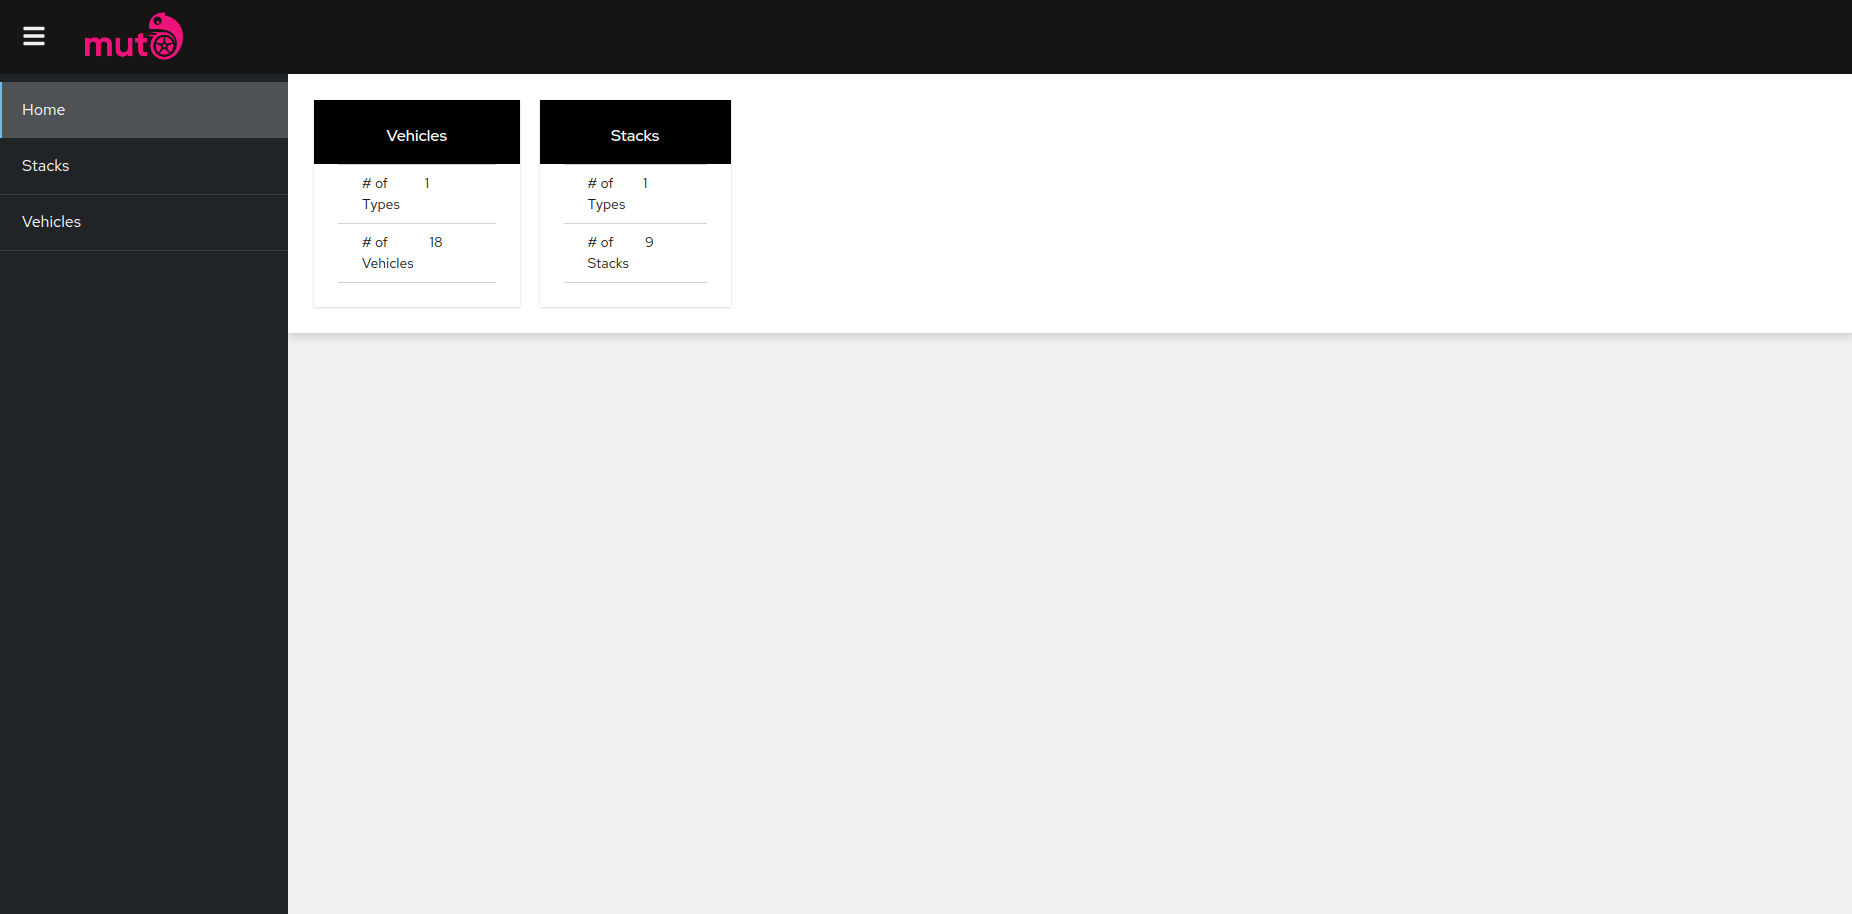
- Open composiv dashboard
Here we are greeted by the summary screen.
This screen has all the vehicles and stacks that are registered.
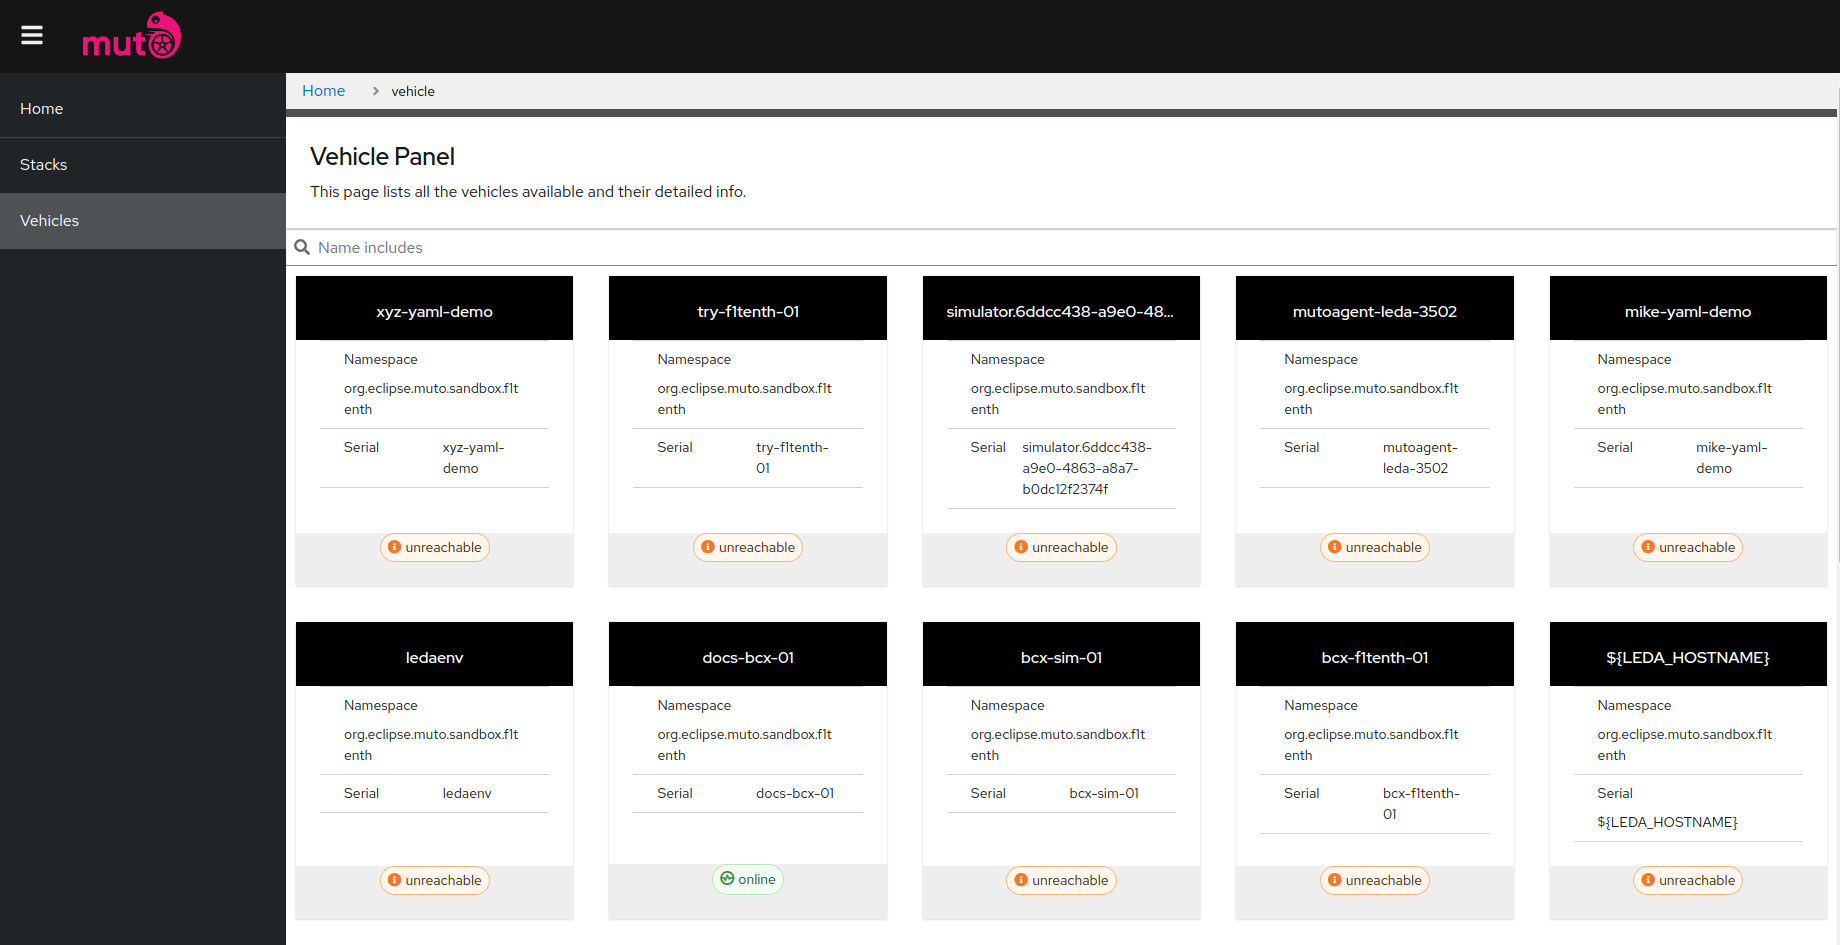
Now we navigate to the Vehicle List
You can see there are several vehicles that are registered here and the ones that are online are designated depending on their status.
To try out the device you can kill the docker image and restart a new one and experiment.
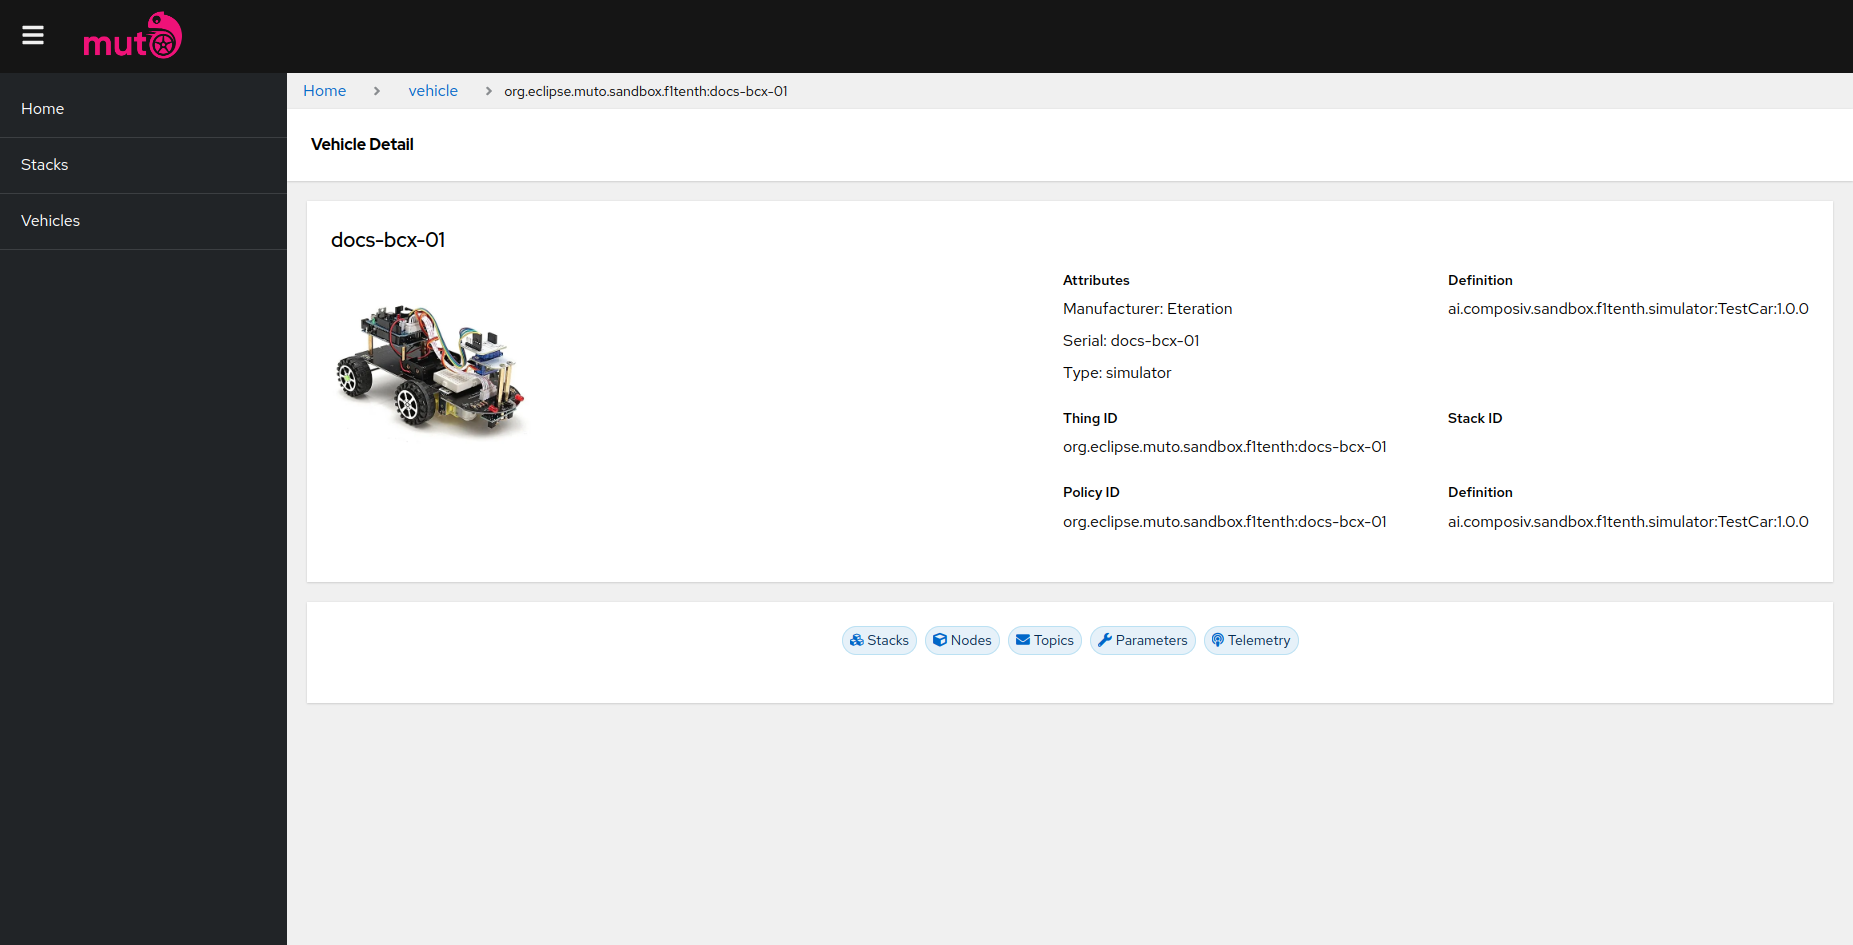
When you click on Vehicle Detail we are greeted by the default design, however we can also see the console output the we observed just now in here.
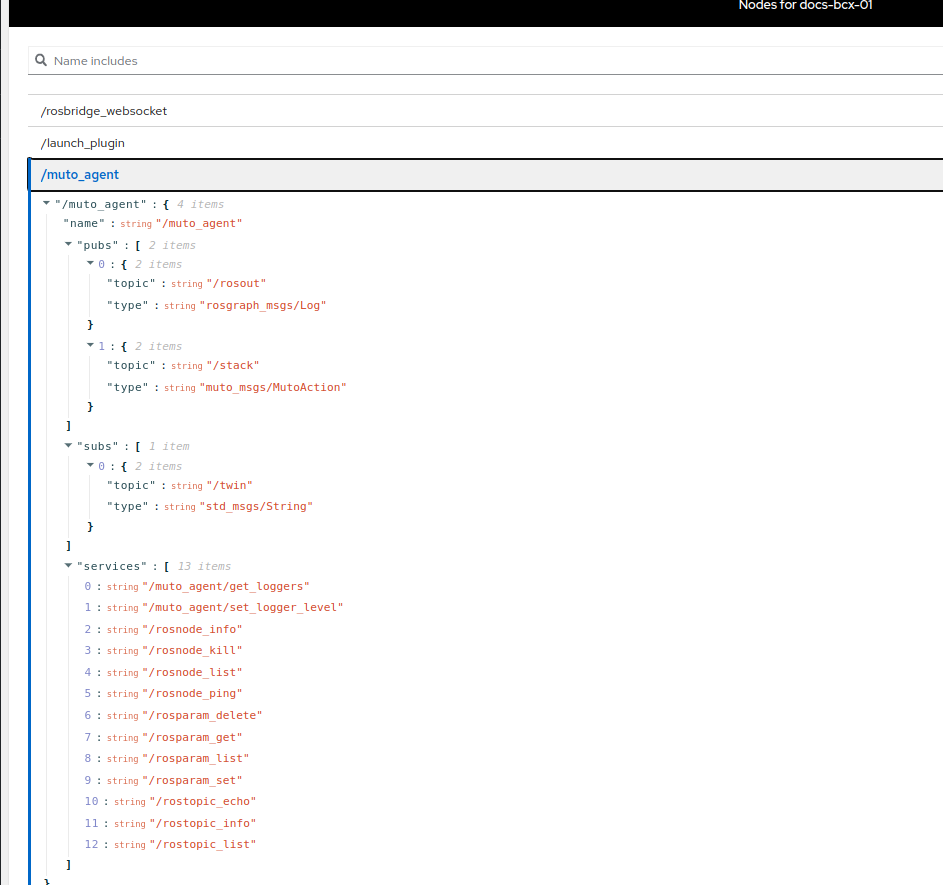
If you open up muto agent from plugins you can see the services supported by muto agent.
Also the rosnode information matches with the corresponding line in our yaml file hence the buttons can work.
Now let's work with a stack. These are the stacks stored in the ditto twin server.
Any one of these stacks can be run if there's current provisioning. (Which is provided for you guys.)
The structure can be defined as a linear flow.
If you navigate to the stacks tab you see the set and apply buttons. if you press set, we can see that something's going on in our console. If not, this may be the result of a refresh issue due to syncronization. You can work around this issue by returning to vehicle list and coming back.

After setting the stack, you can observe that the current stack id has changed.
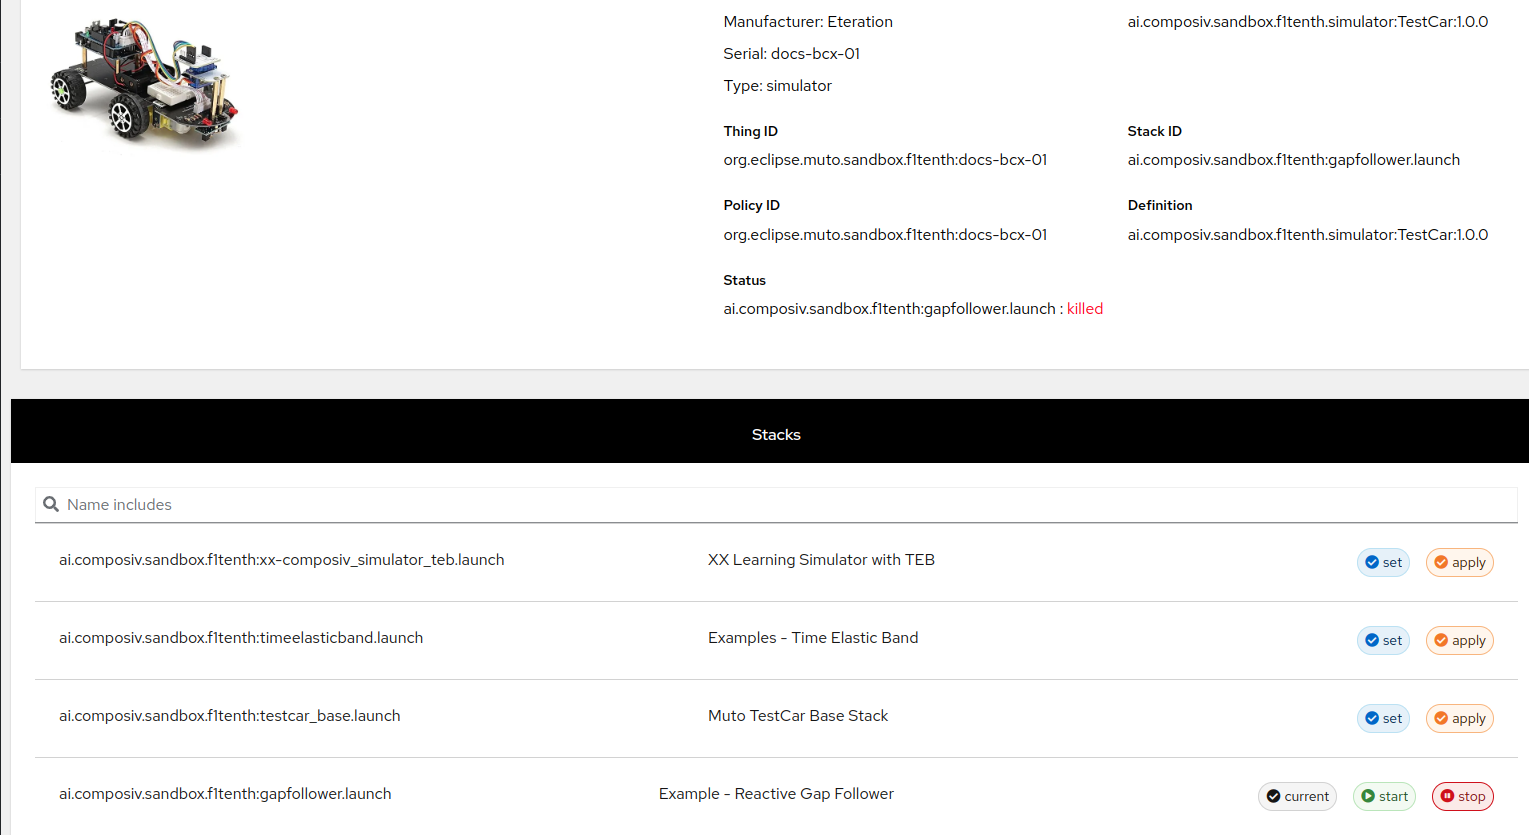
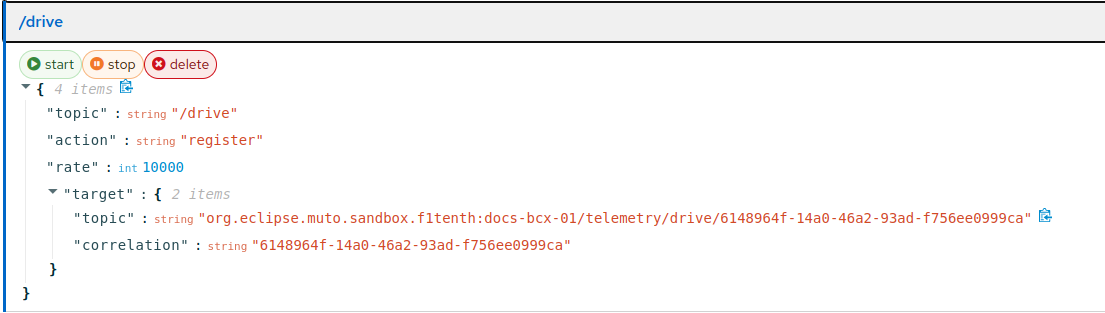
When this list updates you'll see start and stop buttons.
It's pretty straightforward, start executes the stack and stop stops the execution.
When you press start you'll see activity in your console.
After if you navigate back to the node list, you can see all the nodes that muto composer summoned. (Cass-gap-follower for instance)
If you wish to see the parameters used by the system, you can easily do so by navigating to the parameters tab and opening it.
Visualization with the Foxglove Studio
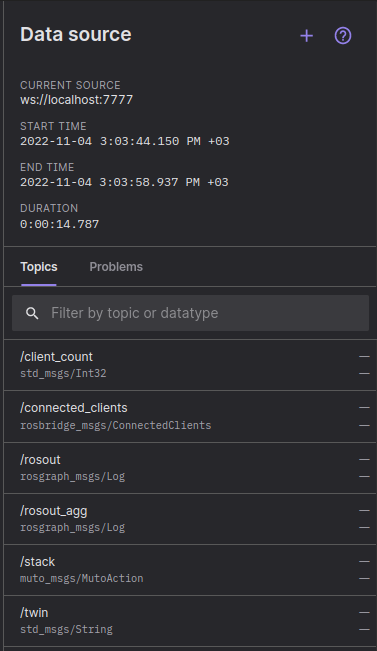
Now navigate to foxglove studio webbsite. Click on Open Connection and change the Port ID from 9090 to your own port ID. In this example, we set the websoocket port to 7777, so set the data connection to ws://locahost:7777 and You should be greeted by a layout similar to :
Now we we can import the layout. These layouts will display predfined panels suitable for visualizarion oıf our example. You'll notice a panel named Publist with the preset key topic. It publishes given keystrokes just like a keyboard. It works like a toggle switch. for instance if you want to start the autopilot, you publish "n" and if you want to stop it you need to republish the same message.
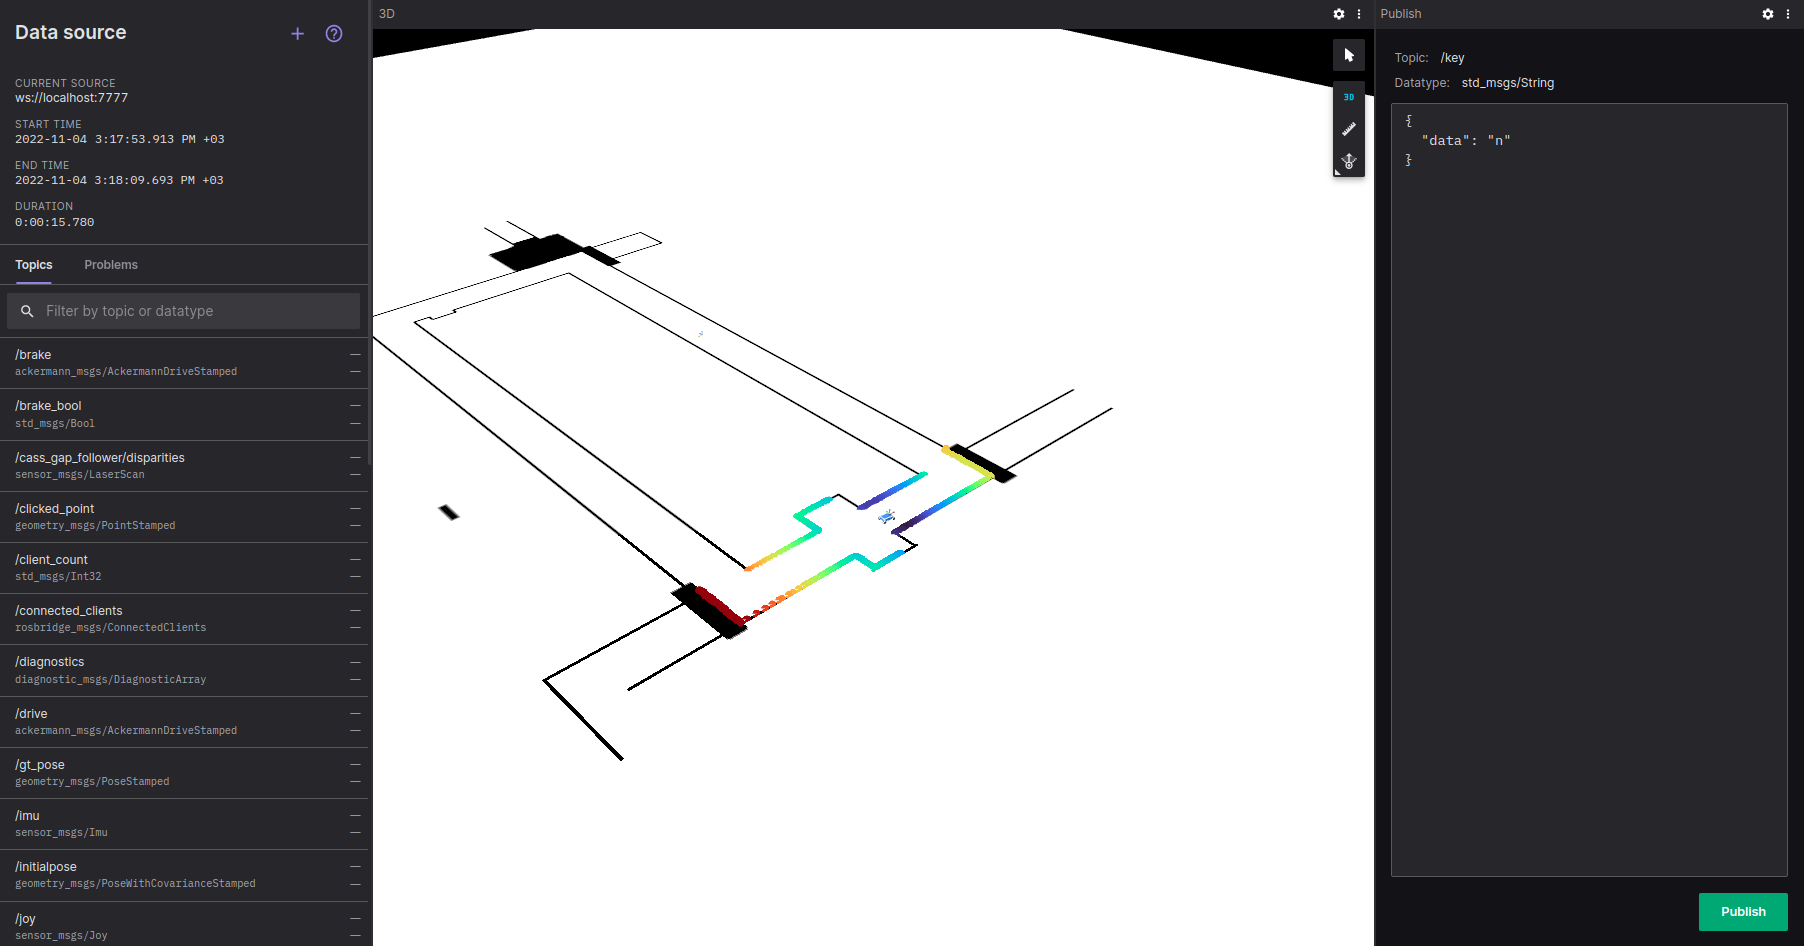
We have the vehicle telemetry in the dashboard but we can also see it here if we wish to do so.
Now let's get back to the vehicle page. Click on Topics and click on /drive.
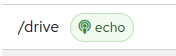
Here we can see all of the telemetry data associated with our drive topic such as ackermann messages.
If you click on echo it will give you an output which'll take you to the same telemetry page.
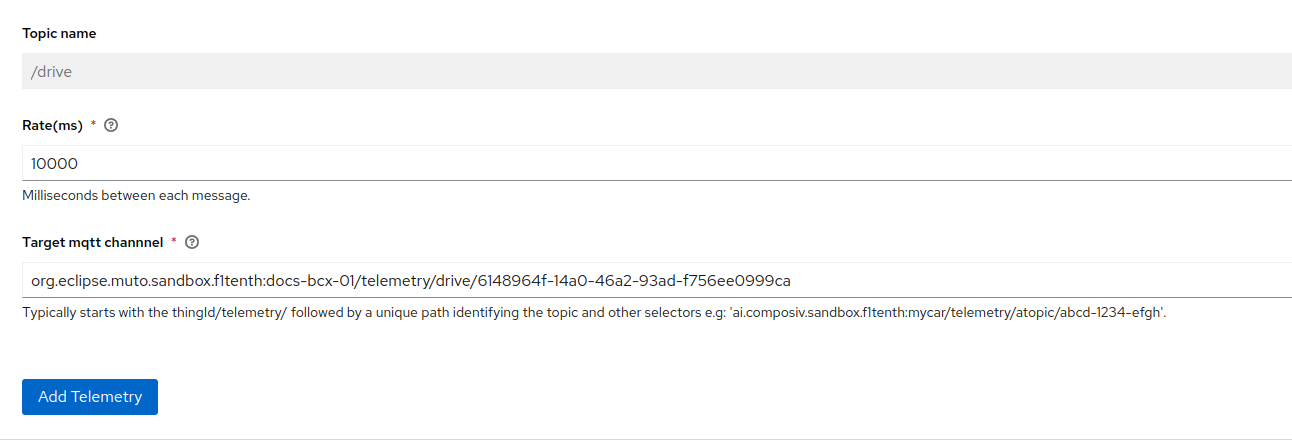
Since this runs on MQTTX protocol, you can copy the corresponding information to memory.
And another feature is that anybody who connects to your MQTT server can "listen" to the published data.
You'll start to see the data when you click on drive and start respectively
RECAP
WHAT HAPPENED ?
Let's have a quick recap
- We checked our topics and defined a telemetry definition.
- We published said definition and we observed it on our screen.
- We stopped the stack and the telemetry data halted. BUT we'll still see the data with every refresh since it's memorized.
- Lastly we checked out similar topic datas using foxglove. (BE CAREFUL Since you don't have the option to set a custom rate in foxglove, you can overwork your system and your computer may slow down quite a bit.)